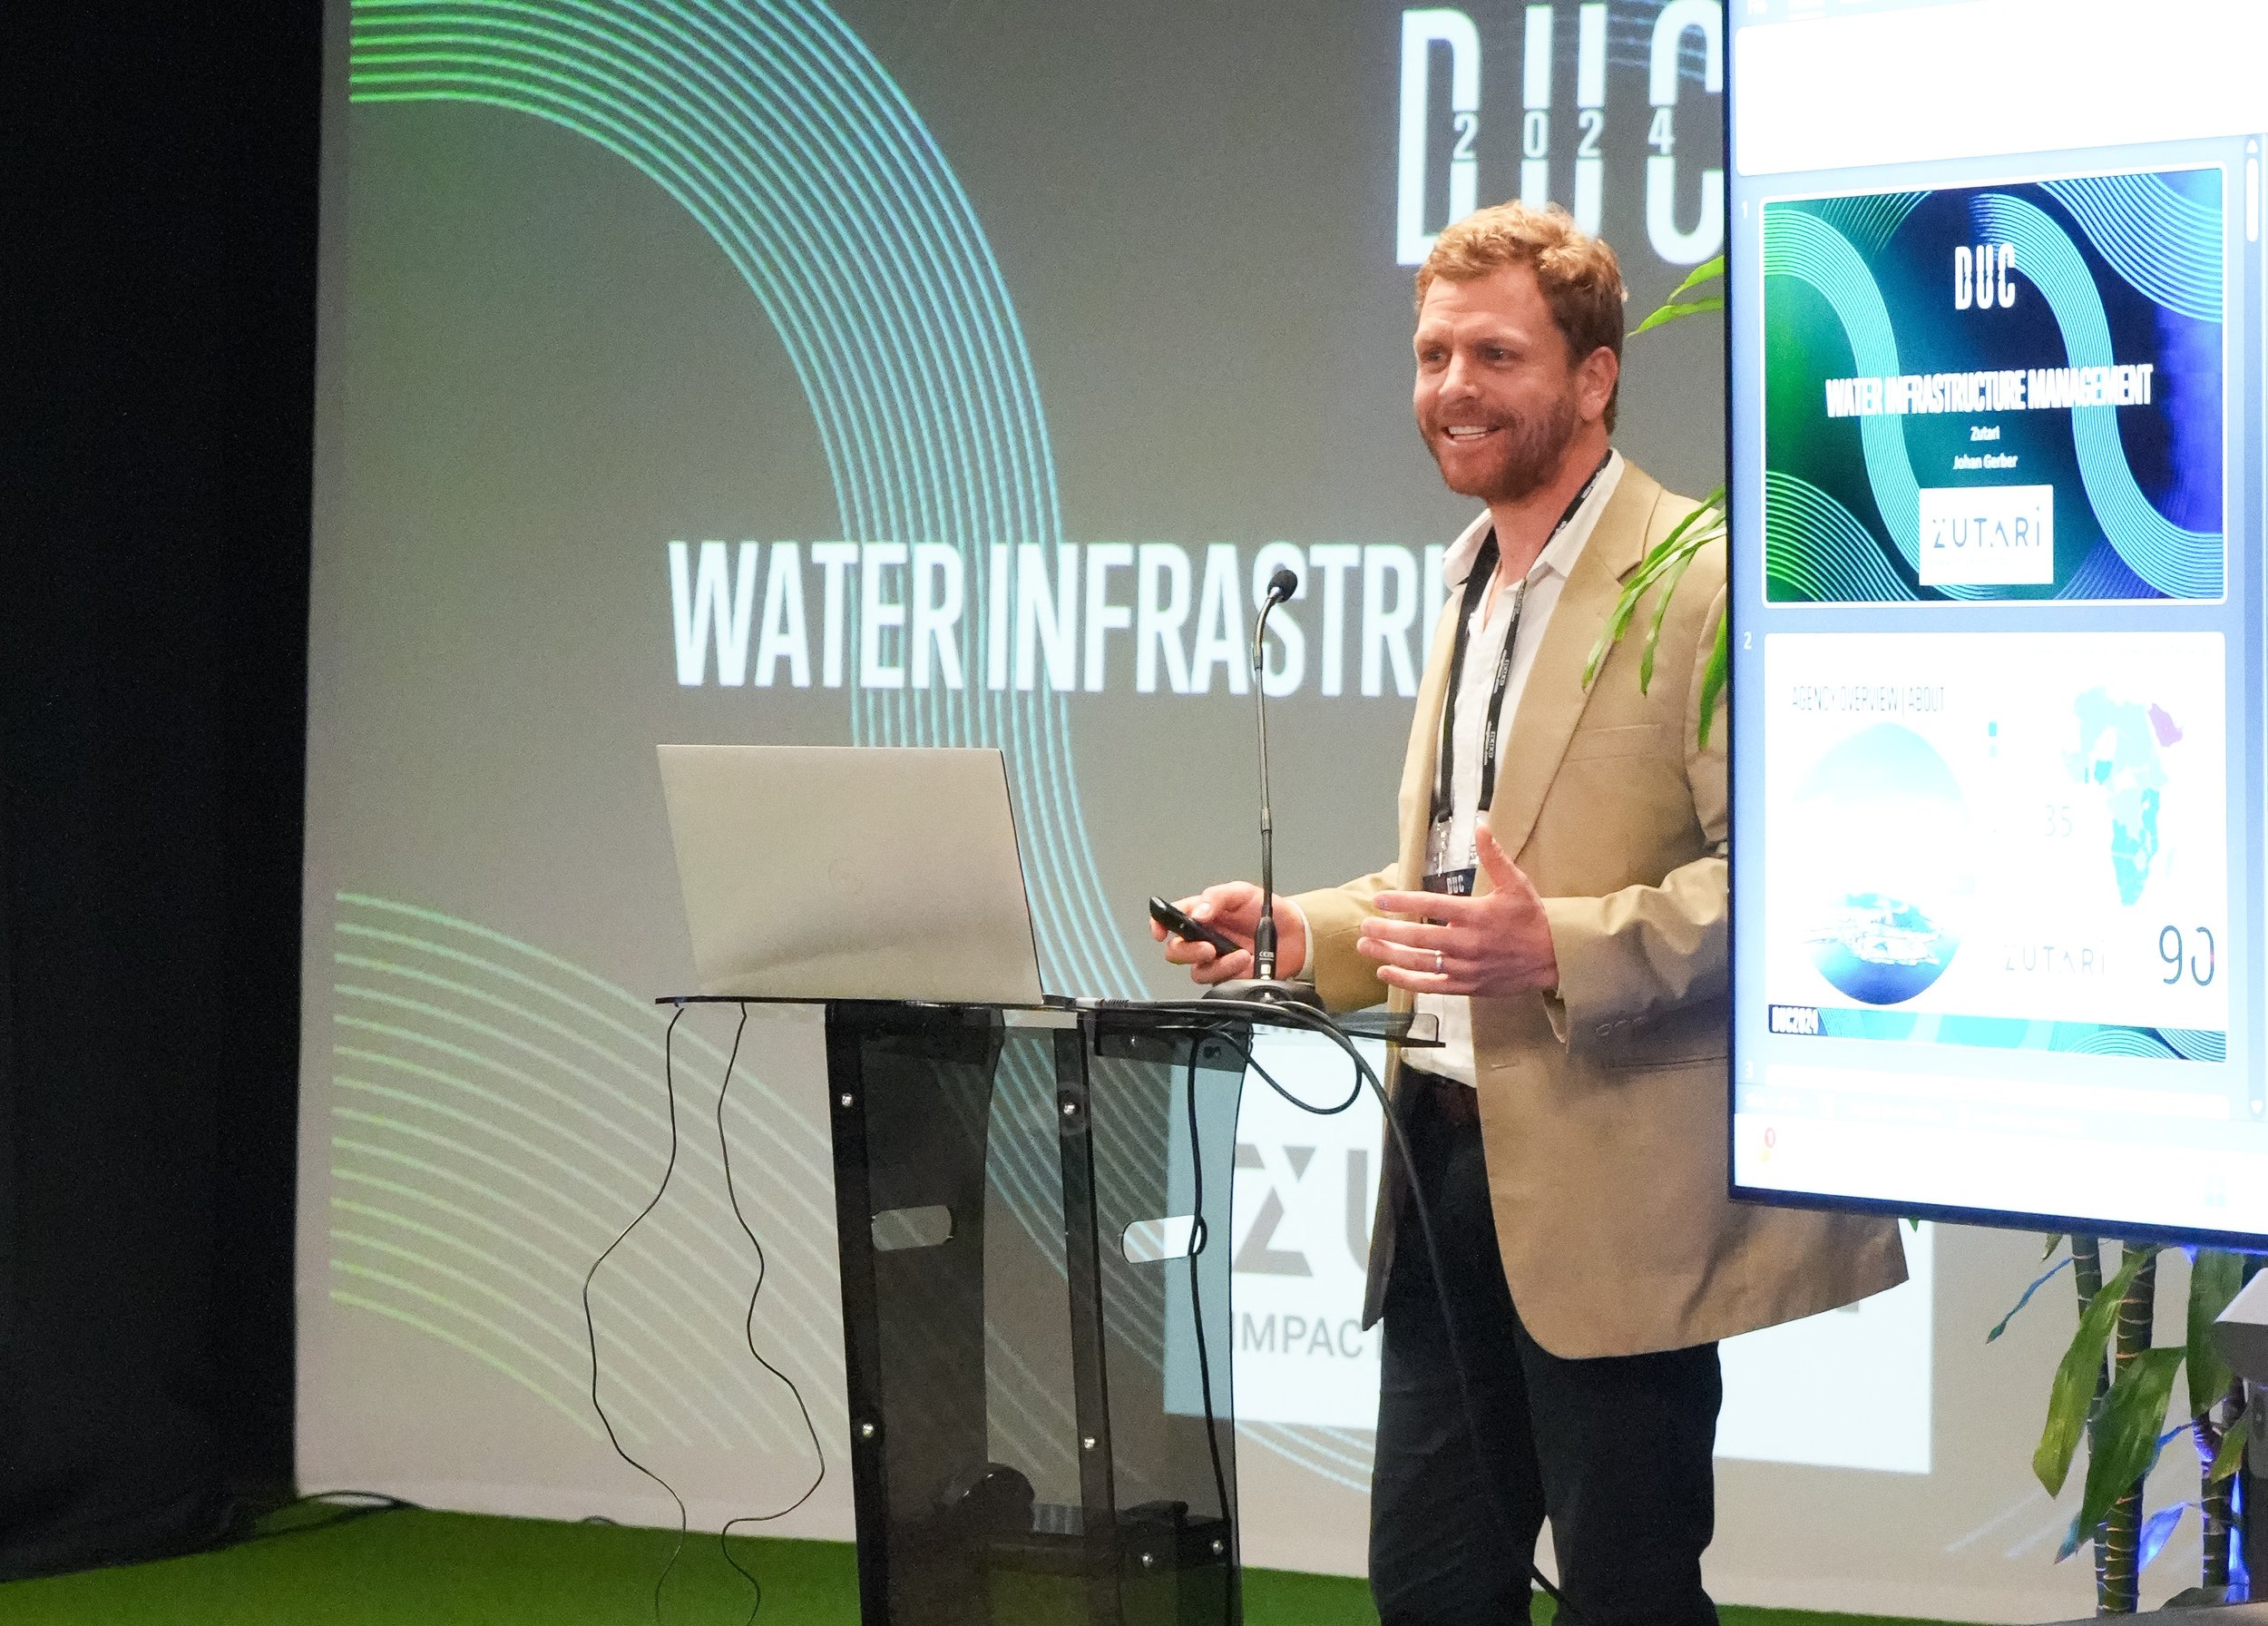


Gary Ruck is a registered Professional Engineer and Project Management Professional in Ontario. He has over 38 years of experience in asset management and is a recognized expert in that field. He is currently the Director of Global Business Development at Deighton Associates Ltd.
Summary
This is the final instalment of a seven-part blog series on the dTIMS Agency Roadmap. Please refer to the introductory blog “Part I - An Agency Roadmap – Do I Need One of Those?” for the basis of this series.
In this instalment, we conclude our series of blogs on the dTIMS Agency Roadmap. Just like with any journey we undertake, we plot a course, we construct a route, we see things along the way, and near the end, we reflect on what we saw before we start thinking about our next journey.
Introduction
I want to summarize this blog by bringing forth two quotes that I used during this series that I believe quite nicely capture the roadmap concept.
“All you need is the plan, the road map, and the courage to press on to your destination.”
I broke this quote down in Blog IV, but essentially, it speaks to the idea that a plan on its own may not amount to much. However, when a roadmap and courage are combined with a plan, you can make your way to your destination.
Over the last couple of decades, many public agencies such as State Departments of Transportation, National agencies, and even municipalities worldwide have implemented asset management systems (AMS). Some of these agencies did so solely in response to legislation that either mandated this or had funding streams tied to the implementation of these systems. The more innovative agencies may have started this way as well, but quickly realized the limitless potential these systems can bring to an agency.
Many of these AMS began as a rudimentary, single-asset management system. Partly because of the lack of good, reliable data to support them, but contributing to this was also the unavailability of good asset management practices that could be adopted. Over the ensuing years, data collection practices and, hence, data quality and availability have improved immensely. There is also a wealth of research and best practices around asset management that can be adopted to increase the maturity level of asset management at an agency.
“Top shelf” agencies have embraced asset management to the point where it is a core practice that is highly valued by all stakeholders in the agency. By looking at several of these “top-shelf” agencies, a few common traits are evident. Each one has a champion who is a driving force of innovation, and this champion has support at all levels of the organization. Also, these top-shelf agencies have a growth mindset such that stagnancy and complacency are simply not an option. They are constantly looking for ways to innovate, whether it is in the data, practices, or solutions. Finally, these top-shelf agencies implemented a system that supports this growth, and they continually reinvest in the system and the people who interact with it.
A common trait of a top-shelf organization is to constantly evaluate where they are in terms of asset management maturity and what they can do to continually improve upon that. For these agencies, perfection is not the goal, but the drive towards perfection is what makes them better. They are not afraid to continually evaluate their practices, recognize any gaps or shortfalls, and address them, resulting in a constant improvement mode.
Series Summary
This blog series breaks down the journey these top-shelf agencies are on, constantly evaluating their current state, identifying areas for improvement, and not being afraid to address them and embrace continual improvements in their quest to become just a little bit better.
The first blog discussed the importance of a growth mindset for improvement, introducing the concepts of vertical and horizontal growth, as well as the Asset Management Maturity (AMM) scale. The second blog provided a means to self-evaluate your agency’s AMM by providing a checklist of 6 questions:
What do you have and where is it?
What is it worth?
What is its condition and expected remaining service life?
What is the level of service expectation, and what needs to be done and when?
How much will it cost, and what is an acceptable risk level?
How do you ensure long-term affordability?
The asset management industry is replete with guidance on how an agency can create its asset management journey. In blog 3, two roadmaps from the Institute of Asset Management (IAM) and Asset Management British Columbia (AMBC) were introduced as examples of published roadmaps. The AMBC roadmap provides the following areas of focus for an agency:
Know Your Assets
Know Your Financial Situation
Understand Decision-making
Manage Your Asset Lifecycle
Know the Rules
Sustainability Monitoring
Blog 4 was more specific to dTIMS and introduced the dTIMS Roadmap. This blog talked about what is required for a roadmap by discussing the following concepts:
A starting point
A route made of interconnected paths (there may be many of these, but ultimately you would settle upon one)
Waypoints
A timeframe
A destination
In blog 5, the dTIMS Asset Management Maturity (AMM) score was detailed as a way of benchmarking and quantifying your agency’s current dTIMS evolution at a point in time, so that areas of improvement are identified, changes and/or innovations can be implemented, and then a re-assessment of the AMM score can be made to track progression. And in blog 6, the three levels of asset management were discussed as a way of demonstrating that AM activities fall into different parts of the agency. Specifically:
Strategic - Where is the agency going, and why is this important
Tactical - What is worth doing and when will it be done
Operational - How are you managing individual assets, and how much are you spending
Conclusion
To conclude, I think this second quote summarizes nicely the idea of growth and constant progression:
“It does not matter how slowly you go so long as you do not stop.”
Three key takeaways from this blog series are:
A growth mindset is critical. Being stagnant or satisfied with the status quo will not get you to where you want or need to be.
A roadmap is the concept that will allow you to go from your current “as-is” position to your future “to-be" position.
Perfection is the enemy of the good. There is no perfect system (or anything for that matter), and trying to attain perfection is impossible. However, progression towards perfection is the best we can do, and we should always strive for that.
Deighton has expertise in guiding agencies along their asset management journeys. The dTIMS product suite is ideally suited to help organizations with all levels of asset management. dTIMS Business Analytics (dTIMS BA) addresses the Strategic and Tactical levels by being able to analyze budget scenarios and show the long-term impacts of them, as well as generating an annual work program for every asset element given a constraint. And dTIMS Operational Management (dTIMS OM) is designed to help organizations program the specific activities that need to occur and track the actual usage of labor, equipment, and materials against the plan. Future products such as dTIMS Tactical will assist agencies in the field to better align their strategic and tactical worlds.
If you are responsible for asset management in your agency, congratulations and good luck to you. The asset management journey is an exciting one, and you should never be afraid to leave your mark. And if you are not sure how your organization is performing and/or could improve, please consider the dTIMS Roadmap to provide you with a maturity score and concrete ways of evaluating your agency’s “as-is” state, along with suggestions to move to a “to-be” state.
I encourage you to reach out to myself or anyone else at Deighton to learn more about the agency roadmap and to participate in and help influence the work Deighton is doing in this area.
Asset Management Roadmap Blog Series:
Part 1: An Agency Roadmap - Do I Need One of Those?
Part 2: The Checklist – What Questions You Can Ask to Help Build a Roadmap
Part 3: A Look at Two Roadmaps – IAM and AMBC
Part 4: The dTIMS Agency Roadmap: Introduction
Part 5: The dTIMS Agency Roadmap: Getting a Score
Part 6: The dTIMS Agency Roadmap: Strategic, Operational, and Tactical
Part 7: The dTIMS Agency Roadmap: Concluding Thoughts